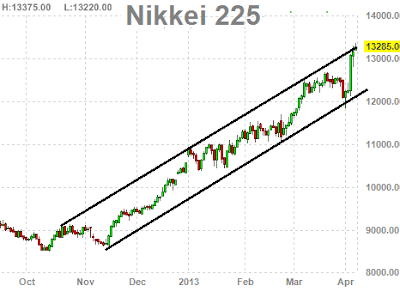
nikkei chart WHAO!
nikkei chart below is going gangbusters. The Nikkei went up 3% today in early trading.
Japan's benchmark Nikkei index nikkei chart revisited the 13,000 mark on Monday, jumping by as much as 3 percent after the yen slid to a four-and-a-half year low against the dollar, as markets continue to respond to the shock monetary therapy unleashed by the Bank of Japan last week.
But it was a bad case of the Monday blues for the rest of Asia after a a disappointing March unemployment report from the United States.
nikkei chart As you can see the nikkei has been in a very nice upwards channel and now is around the top resistance point of that channel at 13285. This strength is amazing but does not surprise us.
WHAT IF YOU KNEW WHICH WAY THE MARKET WAS ABOUT TO MOVE BEFORE IT HAPPENED? CLICK HERE To Join Our VIP ELITE GROUP -- FREE 10 Day Trial Offer Today!


No comments:
Post a Comment