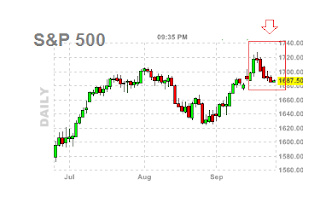
Let's face it, 2013 has been a very good year for the stock market, and traders who have been buying dips, but after the FED meeting a week ago, traders are pausing to worry about what is going on in Washington.
One of the few things you can say about the stock market is it hates uncertainty. Well this is definatly one of those times, and that is why there has been this selling off the last week or so.
The S&P 500 has now had 5 down days in a row now, confirming my thoughts, and we have not seen 5 down days in a row in a LONNGGG time!
 |
| spx daily chart |
WHAT IF YOU KNEW WHICH WAY THE MARKET WAS ABOUT TO MOVE BEFORE IT HAPPENED? CLICK HERE To Join Our VIP ELITE GROUP -- FREE!
Powered by 123ContactForm | Report abuse

No comments:
Post a Comment